Monitoring active fires with next-generation satellites
Contents
Monitoring active fires with next-generation satellites
In the near future, new satellites such as Meteosat Third Generation (MTG) and Metop - Second Generation (Metop-SG) will provide advanced capabilities and valuable data for monitoring fires and their impacts. This three-part case study will introduce upcoming data products from MTG and Metop-SG in the context of the summer wildfires which occurred in southern Italy and Greece in early August 2021. In this part, we will introduce you to new capabilities in monitoring the active fires as part of the fire life cycle with data products from MTG and Metop-SG.
The Case Event
A long period of warm and dry weather led to fires breaking out across the Mediterranean during the summer of 2021. In the Mediterranean region, the winters are rainy and mild while the summers are hot and dry, leading to vegetation stress and the accumulation of fuels in the summer months.
In Greece, the largest wildfires occurred in Attica, Olympia, Messenia, and Evia (also known as Euboea). The fires in Evia, Greece’s second largest island, were particularly devastating. They led to two deaths and destroyed 125,000 hectares of land.
Southern Italy and Sicily were particularly impacted by wildfires. In Calabria, fires restarted in early August in the Aspromonte Mountain around the San Luca Valley, threatening ancient and primaeval beech forests (Faggete vetuste) that are recognised as a UNESCO World Heritage site.
Meteosat Third Generation (MTG)
MTG will see the launch of six new geostationary satellites from 2022 onwards. The satellite series will be based on 3-axis platforms and comprise: four imaging satellites (MTG-I) and two sounding satellites (MTG-S). The full operational configuration will consist of two MTG-I satellites operating in tandem, one scanning Europe and Africa every 10 minutes, and the other scanning only Europe every 2.5 minutes, and one MTG-S satellite. With MTG, the data will have better spatial, temporal & radiometric resolution, so even smaller fires will be detected.
EUMETSAT Polar System - Second Generation (EPS-SG)
The EPS-SG is a partnership programme, which involves the European Space Agency, the German Aerospace Agency and the National Center for Space Studies. The mission is composed of two series of spacecraft, Metop-SG A and B, flying on the same mid-morning orbit, like the current Metop satellites. The orbit height is in the range 823-848 km (dependent on latitudes). There will be three satellites each of Metop-SG A and Metop-SG B. The first two satellites Metop-SG A1 and Metop-SG B1 are planned to be launched in Q2 and Q4 2024 respectively. See here an overview of the planned launch dates.
Consisting of low earth orbiting satellites, Metop-SG will provide high spatial resolution imagery and data. However, they will only cover a smaller observation region and have a longer revisit period compared to geostationary satellites like MTG.
The instruments covered in this case study in order of appearance are Metop-SG’s METimage radiometer, MTG’s Flexible Combined Imager (FCI), Metop-SG’s Sentinel-5 Ultraviolet Visible Near-Infrared Shortwave (UVNS) spectrometer, followed by MTG’s Sentinel-4 UVN spectrometer. While data from MTG and Metop-SG is not yet available, we will be introducing existing data products and explaining how new capabilities will arise from these upcoming satellites.
What is proxy data?
Proxy data refers to “data with valid scientific content, to be used in early training on instrument capabilities and application areas, for example in test beds. These are real datasets from relevant existing precursor instruments.” (Source: EUMETSAT)
Monitoring the fire life cycle consists of three stages: (1) pre-fire, (2) active fire and (3) post-fire. First, we can assess pre-fire risk based on meteorological and vegetation conditions. During the fire, we can detect and monitor the location of active fires as well as smoke being produced by the fires. Finally, after the fires have been extinguished, the burned area and burn severity can be assessed.
EPS-SG METimage
False colour composites
METimage will provide the capability to produce high resolution imagery for monitoring active fire and smoke transport impacts. Figure 1 shows a false colour composite from 7 August 2021 where smoke plumes from the Greek fires in Evia are visible. The proxy data source is Sentinel-3 Ocean and Land Colour Imager (OLCI) which has a spatial resolution of 300m and 21 bands. The recipe for the false colour composites is: Red-Green-Blue Oa17-Oa05-Oa02. This means that the red channel was assigned to band Oa17 (865 nm), the green channel was assigned to band Oa05 (510 nm) and the blue channel was assigned to band Oa02 (412.5nm). This false colour combination highlights healthy vegetation as red and burnt areas as black.
METimage is a multi-spectral (visible and IR) imaging passive radiometer which will provide detailed information on clouds, wind, aerosols and surface properties which are essential for meteorological and climate applications. Compared to its predecessor AVHRR, METimage will have many more channels for the benefit of measuring far more geophysical variables. This combined with on-board radiometric calibration of solar channels and the enhanced spatial sampling (500m compared to 1km at nadir) will provide a breakthrough in several application areas: numerical weather forecast, very short-range forecast and now-casting, oceanography, hydrology, land-surface applications, and climate monitoring.
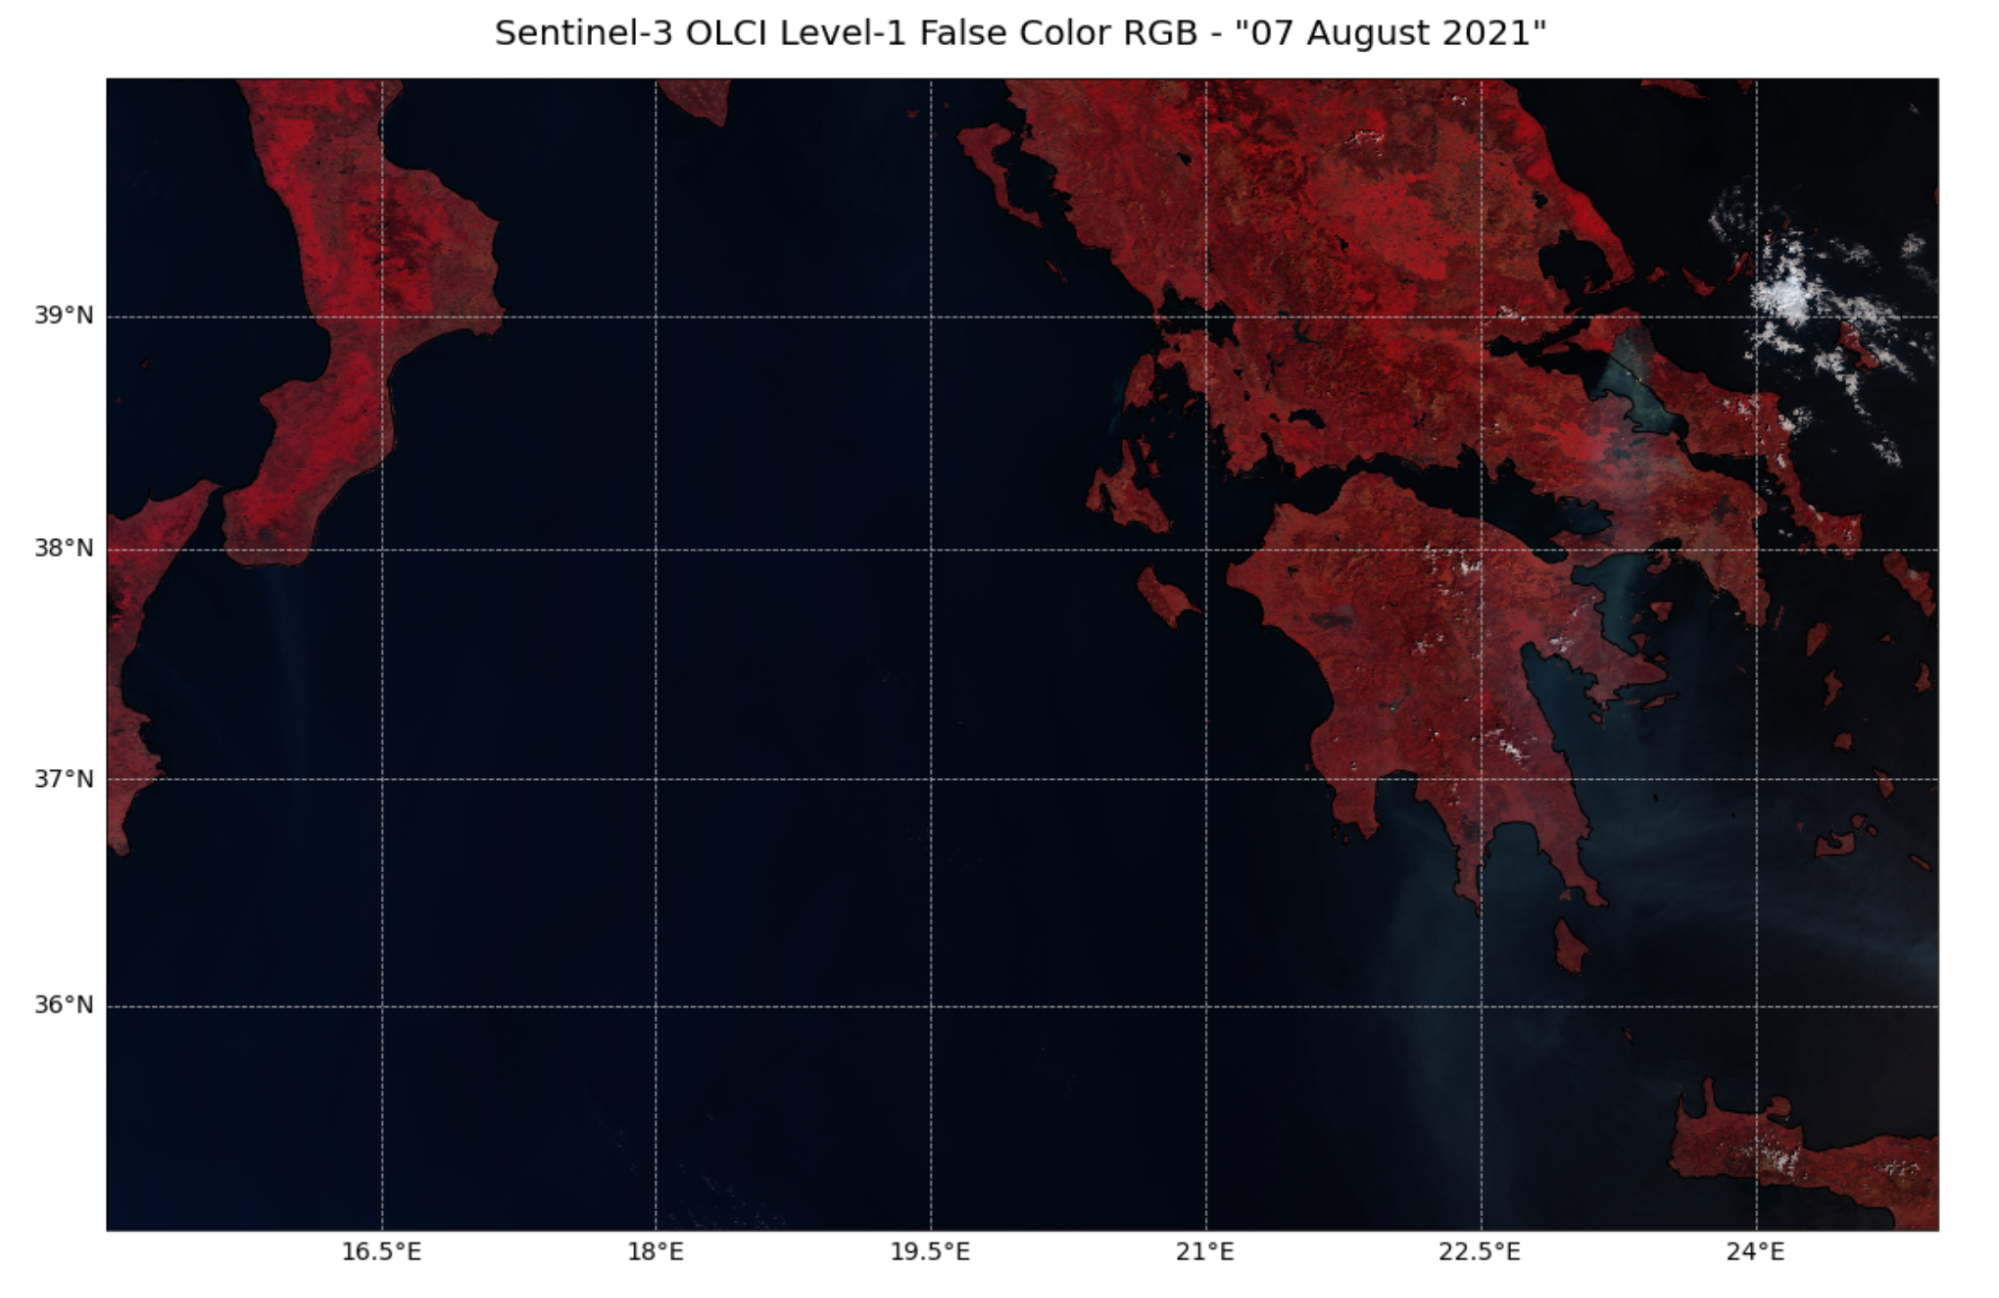
Figure 1. False colour composite from Sentinel-3 OLCI Level-1B data showing smoke plumes from Evia, Greece and from southern Calabria, Italy recorded on 7 August 2021.
Learn how this false colour composite was made.
MTG Flexible Combined Imager
Fire Radiative Power (FRPPIXEL)
The Fire Radiative Power Pixel (FRPPIXEL) product records information on the location, timing and fire radiative power (FRP, in megawatts) output of wildfires detected every 15 minutes across the full MSG disk at the native spatial resolution of the SEVIRI sensor. This enables emergency responders to pinpoint where active fires are burning and have information about how intense these fires are.
Figure 2 shows the fire radiative power in megawatts (M W) over Italy and Greece from 5 August 2021. The proxy data source is the near real-time MODIS Thermal Anomalies/Fire locations 1km FIRMS V0061 (MCD14DL) dataset. While the fire radiative power data is continuous, this visualisation groups them into categories based on their intensity. High intensity fires with fire radiative power of 120 to 500 MW are shown in bright red, while low intensity fires of up to 30 MW are shown in blue. The fires on Evia island are visible in bright red whereas most of the fires in southern Italy are colored blue as they are lower in intensity.
In the future, data from MTG’s Flexible Combined Imager (FCI) instrument will be used for the FRPPIXEL product. The FCI provides 16 channels in the visible and infrared spectrum with a spatial sampling distance in the range of 1 to 2 km and four channels with a spatial sampling distance in the range of 0.5 to 1 km. It will have better spatial, temporal and radiometric resolution than MSG SEVERI, so even smaller fires will be detected. The data provider is LSA SAF, which develops and processes satellite products that characterise the continental surfaces, such as radiation products, vegetation, evapotranspiration and wildfires.
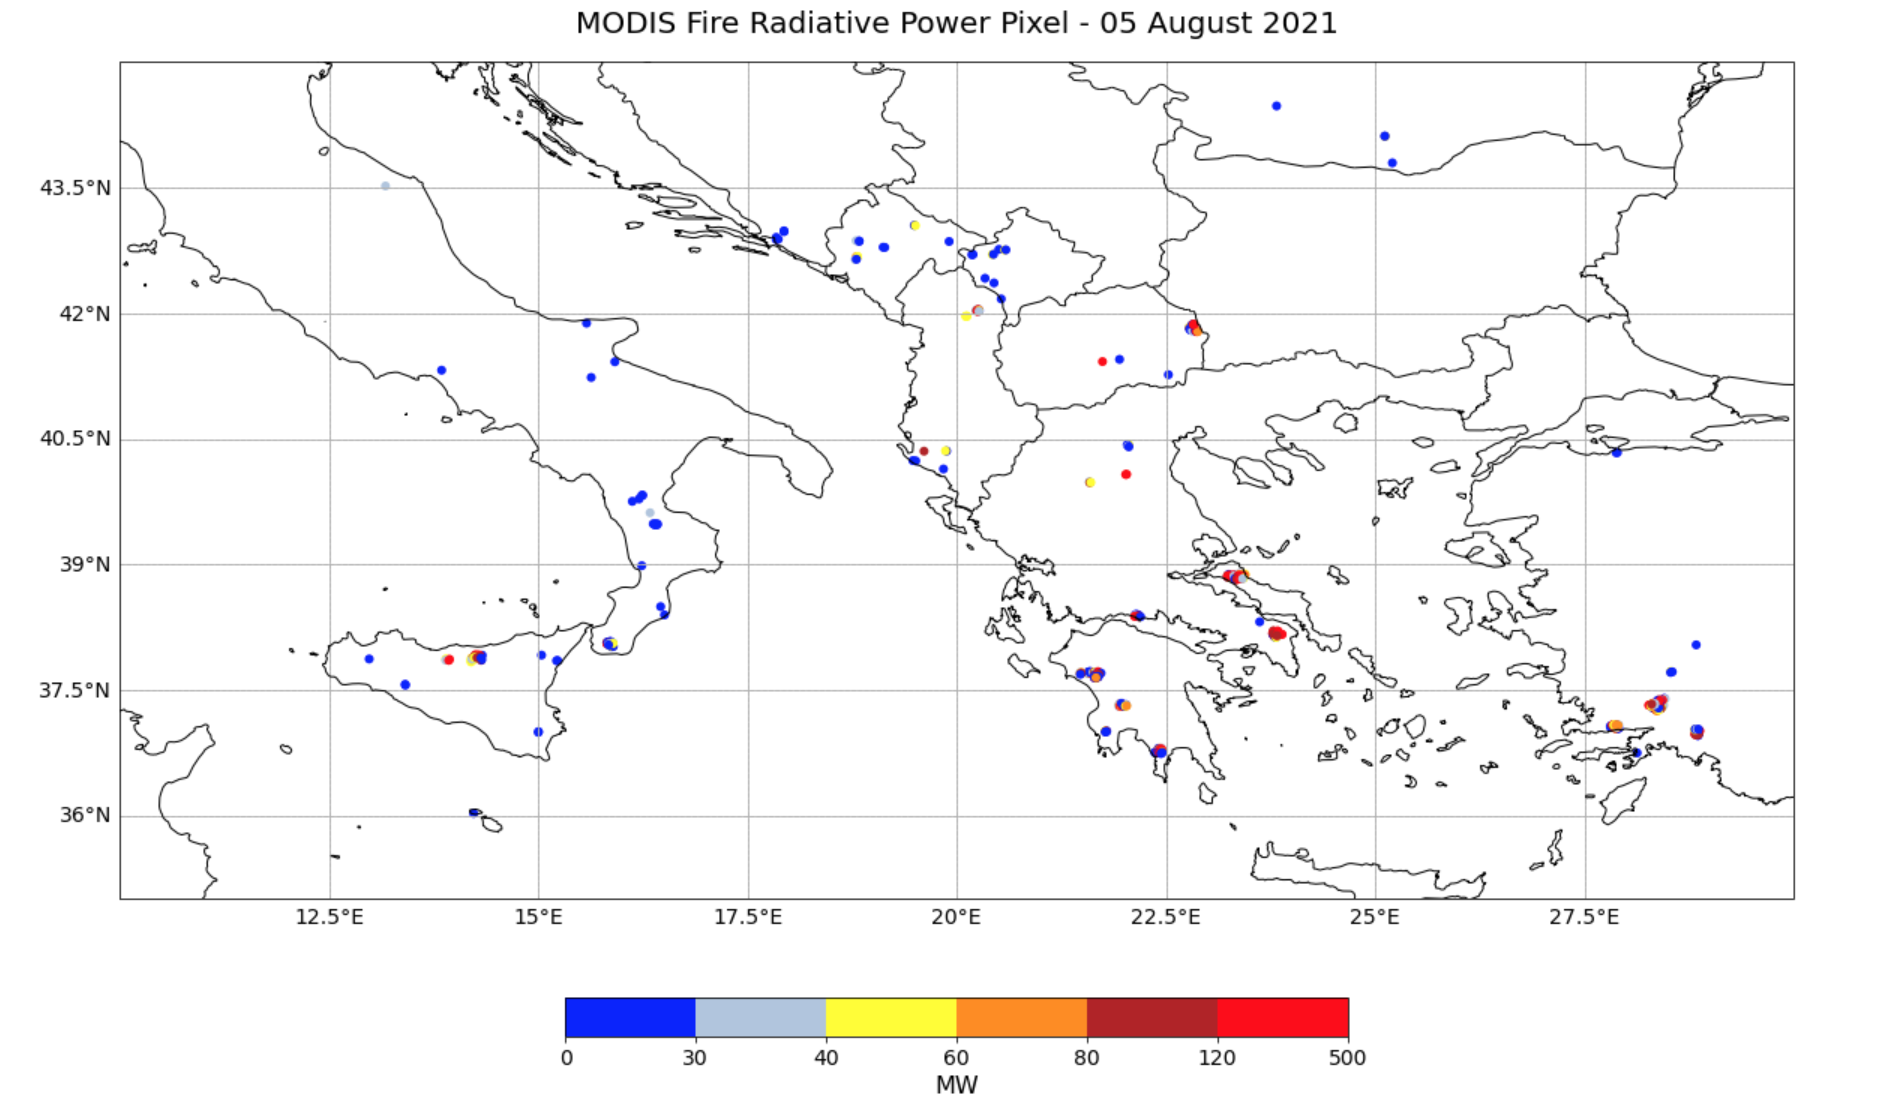
Figure 2. Fire radiative power from MODIS Thermal Anomalies/ Fire Locations data over Italy and Greece from 5 August 2021.
Learn how this plot of fire radiative power was made.
Fire Radiative Power (CAMS GFAS)
Another source of fire radiative power data is the CAMS Global Fire Assimilation System (GFAS). Figure 3 shows the gridded fire radiative power dataset from CAMS GFAS for the same area and day as Figure 2. The fires in Greece and Italy are also visible in this data product, note that fewer lower intensity fires are recorded compared to Figure 2.
GFAS assimilates fire radiative power observations from satellite-based sensors to produce daily estimates of wildfire and biomass burning emissions. It also provides information about injection heights derived from fire observations and meteorological information from the operational weather forecasts of ECMWF. The GFAS data output includes spatially gridded fire radiative power, dry matter burnt and biomass burning emissions for a large set of chemical, greenhouse gas and aerosol species. Data are available globally on a regular latitude-longitude grid with horizontal resolution of 0.1 degrees from 2003 to present.
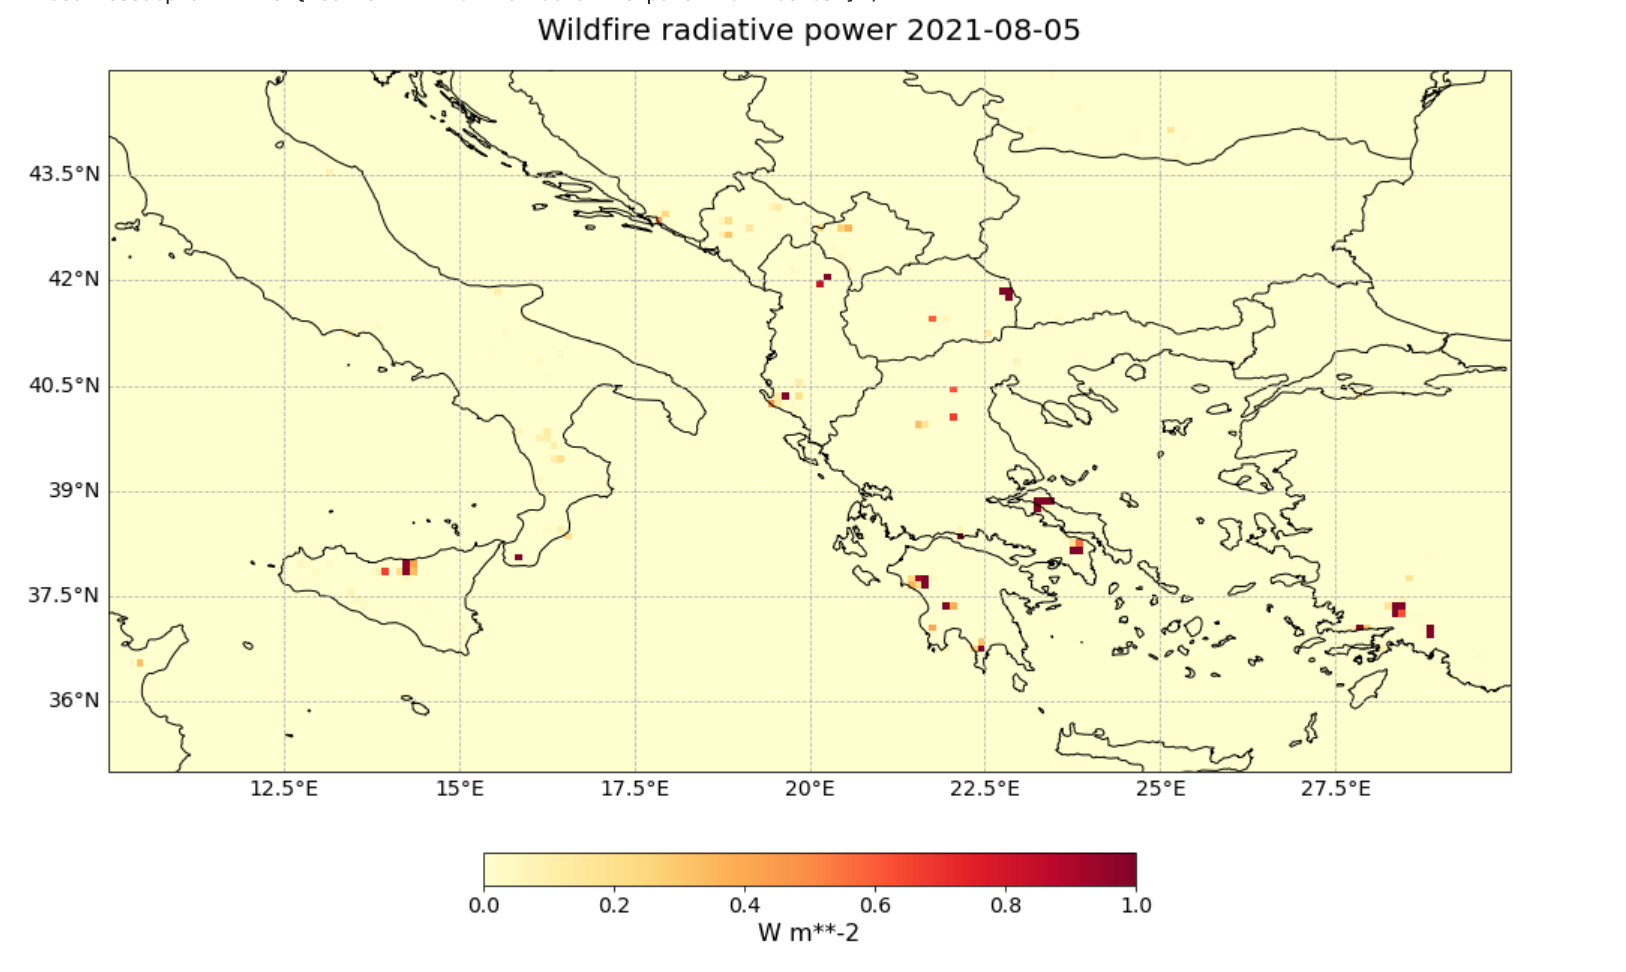
Figure 3. Fire radiative power from CAMS GFAS over Italy and Greece from 5 August 2021.
Learn how this plot of fire radiative power was made.
EPS-SG Sentinel-5 - UVNS
Ultraviolet Aerosol Index
Monitoring trace gases and aerosols is important for understanding smoke transport patterns. Metop-SG A will carry the Copernicus Sentinel-5 UVNS spectrometer for measurements of trace gases which will also improve air quality forecasts produced by CAMS. The UVNS instrument will provide ultraviolet aerosol absorption index information as a Level 2 product. The Greece and Italy wildfires caused an elevated presence of aerosols in the atmosphere as shown by the higher values of the Ultraviolet Aerosol Index Level 2 product in Figure 4. The proxy data comes from Sentinel-5P, the precursor instrument for Sentinel-5.
Compared to its predecessor, GOME-2, the major breakthrough of Sentinel-5 will be a drastically increased spatial sampling at a sampling distance of 7km, and the extension of measurements into the near and short-wave infrared, providing information about aerosols, as well as methane and carbon monoxide in the planetary boundary layer.
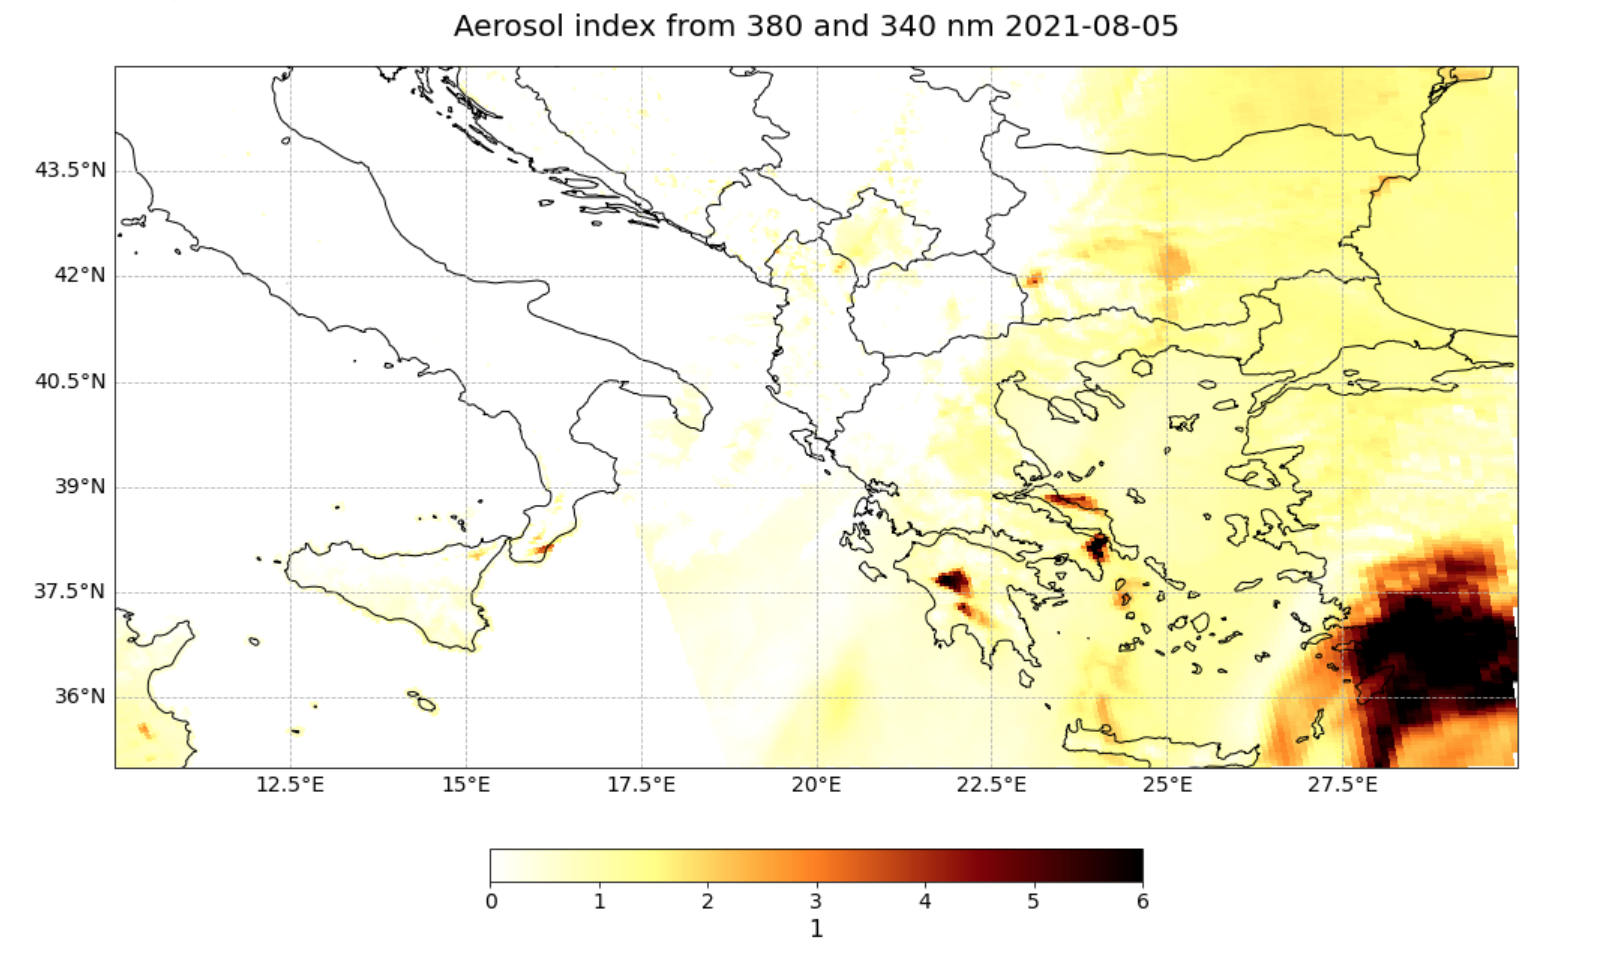
Figure 4. Ultraviolet Aerosol Index (UVAI) Level 2 product from Sentinel-5P TROPOMI over Italy and Greece recorded on 5 August 2021.
Learn how this aerosol index plot was made.
Carbon monoxide total column
The Sentinel-5 UVNS instrument will also be able to monitor the elevated carbon monoxide content in the atmosphere, especially during large wildfires. Carbon monoxide total column data will be provided as a Level 2 product. In Figure 5, the dark blue areas of the plot of total column carbon monoxide show that the background value is around 2-18 molec./cm2. The yellow and green areas of the plot show plumes of carbon monoxide with up to 3 to 4 times the background value. This corresponds to plumes of smoke from the wildfires over Italy and Greece.
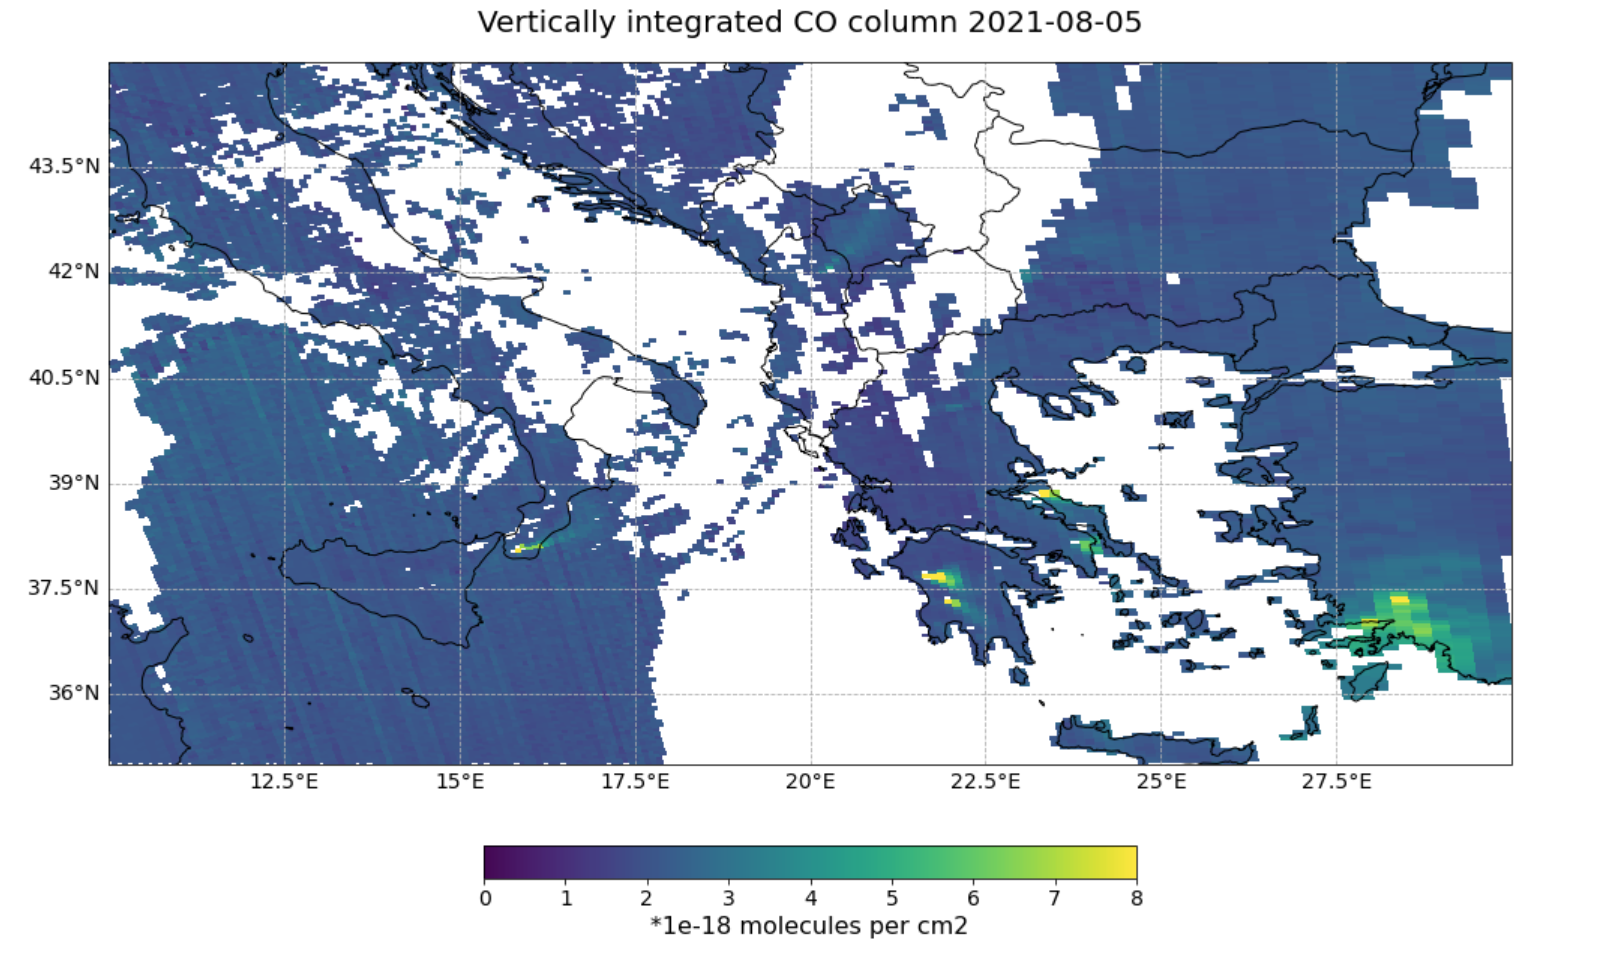
Figure 5. Carbon monoxide (CO) total column Level 2 product from Sentinel-5P TROPOMI over the Mediterranean recorded on 5 August 2021.
Learn how this carbon monoxide total column plot was made.
MTG Sentinel-4 - UVN
Nitrogen dioxide total column
Nitrogen dioxide is another useful indicator of smoke presence and transport. Figure 6 shows an animation of simulated nitrogen dioxide Level 2 data from Sentinel-4 with hourly data for 24 hours on 7 August 2021. Elevated levels of nitrogen dioxide are visible over Italy and Greece where the FRP data shown in Figures 2 and 3 indicate fire locations.
The geostationary Sentinel-4 mission will provide hourly data on tropospheric constituents over Europe for air quality applications. The target species of the Sentinel-4 mission include key air quality parameters such as nitrogen dioxide, ozone, sulphur dioxide, formaldehyde, glyoxal, and aerosols. These species will be monitored by the Sentinel-4 UVN instrument aboard the MTG Sounder satellite.
Figure 6. Simulated nitrogen dioxide Level 2 product from Sentinel-4 UVN spectrometer over the Mediterranean recorded hourly for 24 hours on 7 August 2021.
Learn how this animation of simulated nitrogen dioxide data from Sentinel-4 was made.
References
Copernicus Sentinel data 2021
MODIS Collection 61 Hotspot / Active Fire Detections MCD14ML distributed from NASA FIRMS. Available on-line https://earthdata.nasa.gov/firms. doi:10.5067/FIRMS/MODIS/MCD14ML
Kaiser, J. W., and Coauthors. (2012). Biomass burning emissions estimated with a global fire assimilation system based on observed fire radiative power, Biogeosciences, 9, 527-554, https://doi.org/10.5194/bg-9-527-2012.
Generated using Copernicus Atmosphere Monitoring Service Information 2021
Hersbach, H., Bell, B., Berrisford, P., Biavati, G., Horányi, A., Muñoz Sabater, J., Nicolas, J., Peubey, C., Radu, R., Rozum, I., Schepers, D., Simmons, A., Soci, C., Dee, D., Thépaut, J-N. (2018): ERA5 hourly data on single levels from 1959 to present. Copernicus Climate Change Service (C3S) Climate Data Store (CDS). 10.24381/cds.adbb2d47