Copernicus Sentinel-5P TROPOMI - Ultraviolet Aerosol Index - Level 2
Contents
Copernicus Sentinel-5P TROPOMI - Ultraviolet Aerosol Index - Level 2
The Copernicus Sentinel-5 Ultraviolet Visible Near-Infrared Shortwave (UVNS) spectrometer enables the measurement of trace gases which will improve air quality forecasts produced by the Copernicus Atmosphere Monitoring service.
This notebook provides you an introduction to data from Sentinel-5P, the precursor instrument and proxy for data from Sentinel-5.
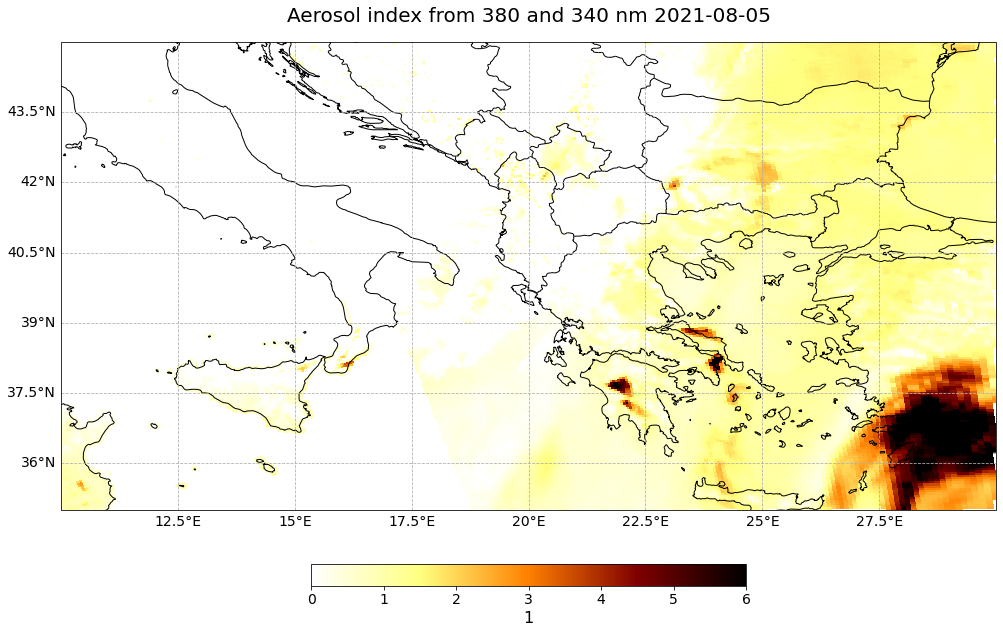
The event that this notebook hightlights are the fires in southern Italy and in Greece during August 2021.
For monitoring smoke, the TROPOMI UV Aerosol Index (UVAI) data can be used. Positive values of UVAI (typically > about 1.0) indicate the presence of absorbing-type aerosols:
smoke from forest fires,volcanic ash, ordesert dust.
Basic Facts
Spatial resolution: Up to 5.5* km x 3.5 km (5.5 km in the satellite flight direction and 3.5 km in the perpendicular direction at nadir)
Spatial coverage: Global
Revisit time: less than one day
Data availability: since April 2018
How to access the data
Sentinel-5P Pre-Ops data are disseminated in the netCDF format and can be downloaded via the Copernicus Open Access Hub. You need to register for an account before downloading data.
Load required libraries
import os
import xarray as xr
import matplotlib.pyplot as plt
import numpy as np
from datetime import datetime
from netCDF4 import Dataset

# Python libraries for visualization
import matplotlib.cm as cm
import matplotlib.colors
from matplotlib.axes import Axes
import cartopy.crs as ccrs
from cartopy.mpl.gridliner import LONGITUDE_FORMATTER, LATITUDE_FORMATTER
from cartopy.mpl.geoaxes import GeoAxes
GeoAxes._pcolormesh_patched = Axes.pcolormesh

import warnings
warnings.filterwarnings('ignore')
warnings.simplefilter(action = "ignore", category = RuntimeWarning)
Load helper functions
%run ../functions.ipynb
Load and browse Sentinel-5P TROPOMI Aerosol Index Level 2 data
A Sentinel-5P TROPOMI UVAI Level 2 file is organised in two groups: PRODUCT and METADATA. The PRODUCT group stores the main data fields of the product, including latitude, longitude and the variable itself. The METADATA group provides additional metadata items.
Sentinel-5P TROPOMI variables have the following dimensions:
scanline: the number of measurements in the granule / along-track dimension indexground_pixel: the number of spectra in a measurement / across-track dimension indextime: time reference for the datacorner: pixel corner indexlayer: this dimension indicates the vertical grid of profile variables
Sentinel-5P TROPOMI data is disseminated in netCDF. You can load a netCDF file with the open_dataset() function of the xarray library. In order to load the variable as part of a Sentinel-5P data files, you have to specify the following keyword arguments:
group='PRODUCT': to load thePRODUCTgroup.
Let us load a Sentinel-5P TROPOMI data file as xarray.Dataset from 5 August 2021 and inspect the data structure:
s5p = xr.open_dataset('../data/sentinel-5p/uvai/2021/08/05/S5P_OFFL_L2__AER_AI_20210805T110012_20210805T124141_19750_02_020200_20210807T004652.nc', group='PRODUCT')
s5p
<xarray.Dataset>
Dimensions:                          (scanline: 4172, ground_pixel: 450, time: 1, corner: 4)
Coordinates:
  * scanline                         (scanline) float64 0.0 1.0 ... 4.171e+03
  * ground_pixel                     (ground_pixel) float64 0.0 1.0 ... 449.0
  * time                             (time) datetime64[ns] 2021-08-05
  * corner                           (corner) float64 0.0 1.0 2.0 3.0
    latitude                         (time, scanline, ground_pixel) float32 ...
    longitude                        (time, scanline, ground_pixel) float32 ...
Data variables:
    delta_time                       (time, scanline) datetime64[ns] 2021-08-...
    time_utc                         (time, scanline) object '2021-08-05T11:2...
    qa_value                         (time, scanline, ground_pixel) float32 ...
    aerosol_index_354_388            (time, scanline, ground_pixel) float32 ...
    aerosol_index_340_380            (time, scanline, ground_pixel) float32 ...
    aerosol_index_354_388_precision  (time, scanline, ground_pixel) float32 ...
aerosol_index_340_380_precision (time, scanline, ground_pixel) float32 ...- scanline: 4172
- ground_pixel: 450
- time: 1
- corner: 4
- scanline(scanline)float640.0 1.0 2.0 ... 4.17e+03 4.171e+03
- units :
- 1
- axis :
- Y
- long_name :
- along-track dimension index
- comment :
- This coordinate variable defines the indices along track; index starts at 0
array([0.000e+00, 1.000e+00, 2.000e+00, ..., 4.169e+03, 4.170e+03, 4.171e+03])
- ground_pixel(ground_pixel)float640.0 1.0 2.0 ... 447.0 448.0 449.0
- units :
- 1
- axis :
- X
- long_name :
- across-track dimension index
- comment :
- This coordinate variable defines the indices across track, from west to east; index starts at 0
array([ 0., 1., 2., ..., 447., 448., 449.])
- time(time)datetime64[ns]2021-08-05
- standard_name :
- time
- axis :
- T
- long_name :
- reference time for the measurements
- comment :
- The time in this variable corresponds to the time in the time_reference global attribute
array(['2021-08-05T00:00:00.000000000'], dtype='datetime64[ns]')
- corner(corner)float640.0 1.0 2.0 3.0
- units :
- 1
- long_name :
- pixel corner index
- comment :
- This coordinate variable defines the indices for the pixel corners; index starts at 0 (counter-clockwise, starting from south-western corner of the pixel in ascending part of the orbit)
array([0., 1., 2., 3.])
- latitude(time, scanline, ground_pixel)float32...
- long_name :
- pixel center latitude
- units :
- degrees_north
- standard_name :
- latitude
- valid_min :
- -90.0
- valid_max :
- 90.0
- bounds :
- /PRODUCT/SUPPORT_DATA/GEOLOCATIONS/latitude_bounds
[1877400 values with dtype=float32]
- longitude(time, scanline, ground_pixel)float32...
- long_name :
- pixel center longitude
- units :
- degrees_east
- standard_name :
- longitude
- valid_min :
- -180.0
- valid_max :
- 180.0
- bounds :
- /PRODUCT/SUPPORT_DATA/GEOLOCATIONS/longitude_bounds
[1877400 values with dtype=float32]
- delta_time(time, scanline)datetime64[ns]...
- long_name :
- offset of start time of measurement relative to time_reference
array([['2021-08-05T11:21:47.152000000', '2021-08-05T11:21:47.992000000', '2021-08-05T11:21:48.832000000', ..., '2021-08-05T12:20:09.031000000', '2021-08-05T12:20:09.871000000', '2021-08-05T12:20:10.711000000']], dtype='datetime64[ns]') - time_utc(time, scanline)object...
- long_name :
- Time of observation as ISO 8601 date-time string
array([['2021-08-05T11:21:47.152000Z', '2021-08-05T11:21:47.992000Z', '2021-08-05T11:21:48.832000Z', ..., '2021-08-05T12:20:09.031000Z', '2021-08-05T12:20:09.871000Z', '2021-08-05T12:20:10.711000Z']], dtype=object) - qa_value(time, scanline, ground_pixel)float32...
- units :
- 1
- valid_min :
- 0
- valid_max :
- 100
- long_name :
- data quality value
- comment :
- A continuous quality descriptor, varying between 0 (no data) and 1 (full quality data). Recommend to ignore data with qa_value < 0.5
[1877400 values with dtype=float32]
- aerosol_index_354_388(time, scanline, ground_pixel)float32...
- units :
- 1
- proposed_standard_name :
- ultraviolet_aerosol_index
- comment :
- Aerosol index from 388 and 354 nm
- long_name :
- Aerosol index from 388 and 354 nm
- radiation_wavelength :
- [354. 388.]
- ancillary_variables :
- aerosol_index_354_388_precision
[1877400 values with dtype=float32]
- aerosol_index_340_380(time, scanline, ground_pixel)float32...
- units :
- 1
- proposed_standard_name :
- ultraviolet_aerosol_index
- comment :
- Aerosol index from 380 and 340 nm
- long_name :
- Aerosol index from 380 and 340 nm
- radiation_wavelength :
- [340. 380.]
- ancillary_variables :
- aerosol_index_340_380_precision
[1877400 values with dtype=float32]
- aerosol_index_354_388_precision(time, scanline, ground_pixel)float32...
- units :
- 1
- proposed_standard_name :
- ultraviolet_aerosol_index standard_error
- comment :
- Precision of aerosol index from 388 and 354 nm
- long_name :
- Precision of aerosol index from 388 and 354 nm
- radiation_wavelength :
- [354. 388.]
[1877400 values with dtype=float32]
- aerosol_index_340_380_precision(time, scanline, ground_pixel)float32...
- units :
- 1
- proposed_standard_name :
- ultraviolet_aerosol_index standard_error
- comment :
- Precision of aerosol index from 380 and 340 nm
- long_name :
- Precision of aerosol index from 380 and 340 nm
- radiation_wavelength :
- [340. 380.]
[1877400 values with dtype=float32]
Retrieve the Aerosol index from 340 and 380 nm
The Sentinel-5P TROPOMI aerosol index data provide the Aerosol Index for two different wavelength pairs:
340_380 nm354_388 nm
For both parameters the interpretation of the index value is the same.
Let us use the aerosol index for the wavelength pair 340_380 nm. The variable name is aerosol_index_340_380. You can select the variable from the data set, together with the geo-coordinates as follows:
uvai = s5p.aerosol_index_340_380[0,:,:]
lat = uvai.latitude
lon = uvai.longitude
Read and apply the Quality Flag to the UVAI data
Another important parameter to read is the general quality flag called qa_value. The quality flag removes the sun glint pixels, where “falsely” high positive UVAI values over sea can be detected. In order to exclude sun glint, it is recommended to use only values where the qa_value is higher than 0.8.
qa=s5p.qa_value[0,:,:]
The final step before plotting is to mask the aerosol index data based on the qa mask. You filter data with the xarray function where.
uvai_masked=uvai.where(qa > 0.8)
Create a geographical subset around Italy and Greece
You can zoom into a region by specifying a bounding box of interest. Let us set the extent to Italy and Greece with the following bounding box information:
lonmin=10
lonmax=30
latmin=35
latmax=45
You can use the function generate_geographical_subset to subset an xarray.DataArray based on a given bounding box.
s5p_uvai_subset = generate_geographical_subset(xarray=uvai_masked,
                                             latmin=latmin,
                                             latmax=latmax,
                                             lonmin=lonmin,
                                             lonmax=lonmax)
s5p_uvai_subset
<xarray.DataArray 'aerosol_index_340_380' (scanline: 243, ground_pixel: 359)>
array([[nan, nan, nan, ..., nan, nan, nan],
       [nan, nan, nan, ..., nan, nan, nan],
       [nan, nan, nan, ..., nan, nan, nan],
       ...,
       [nan, nan, nan, ..., nan, nan, nan],
       [nan, nan, nan, ..., nan, nan, nan],
       [nan, nan, nan, ..., nan, nan, nan]], dtype=float32)
Coordinates:
  * scanline      (scanline) float64 2.36e+03 2.361e+03 ... 2.601e+03 2.602e+03
  * ground_pixel  (ground_pixel) float64 77.0 78.0 79.0 ... 433.0 434.0 435.0
    time          datetime64[ns] 2021-08-05
    latitude      (scanline, ground_pixel) float32 32.12 32.14 ... 46.68 46.68
    longitude     (scanline, ground_pixel) float32 11.19 11.26 ... 29.7 29.8
Attributes:
    units:                   1
    proposed_standard_name:  ultraviolet_aerosol_index
    comment:                 Aerosol index from 380 and 340 nm
    long_name:               Aerosol index from 380 and 340 nm
    radiation_wavelength:    [340. 380.]
ancillary_variables: aerosol_index_340_380_precision- scanline: 243
- ground_pixel: 359
- nan nan nan nan nan nan nan nan ... nan nan nan nan nan nan nan nan
array([[nan, nan, nan, ..., nan, nan, nan], [nan, nan, nan, ..., nan, nan, nan], [nan, nan, nan, ..., nan, nan, nan], ..., [nan, nan, nan, ..., nan, nan, nan], [nan, nan, nan, ..., nan, nan, nan], [nan, nan, nan, ..., nan, nan, nan]], dtype=float32) - scanline(scanline)float642.36e+03 2.361e+03 ... 2.602e+03
- units :
- 1
- axis :
- Y
- long_name :
- along-track dimension index
- comment :
- This coordinate variable defines the indices along track; index starts at 0
array([2360., 2361., 2362., ..., 2600., 2601., 2602.])
- ground_pixel(ground_pixel)float6477.0 78.0 79.0 ... 434.0 435.0
- units :
- 1
- axis :
- X
- long_name :
- across-track dimension index
- comment :
- This coordinate variable defines the indices across track, from west to east; index starts at 0
array([ 77., 78., 79., ..., 433., 434., 435.])
- time()datetime64[ns]2021-08-05
- standard_name :
- time
- axis :
- T
- long_name :
- reference time for the measurements
- comment :
- The time in this variable corresponds to the time in the time_reference global attribute
array('2021-08-05T00:00:00.000000000', dtype='datetime64[ns]') - latitude(scanline, ground_pixel)float3232.12 32.14 32.17 ... 46.68 46.68
- long_name :
- pixel center latitude
- units :
- degrees_north
- standard_name :
- latitude
- valid_min :
- -90.0
- valid_max :
- 90.0
- bounds :
- /PRODUCT/SUPPORT_DATA/GEOLOCATIONS/latitude_bounds
array([[32.12033 , 32.14433 , 32.168037, ..., 34.96878 , 34.966583, 34.964294], [32.16859 , 32.192604, 32.216316, ..., 35.017277, 35.015064, 35.012764], [32.216835, 32.240856, 32.264584, ..., 35.06577 , 35.063545, 35.061234], ..., [43.59572 , 43.622807, 43.64955 , ..., 46.589333, 46.584236, 46.57898 ], [43.64298 , 43.670074, 43.696842, ..., 46.63765 , 46.632534, 46.62727 ], [43.690258, 43.71738 , 43.744156, ..., 46.686016, 46.68088 , 46.675602]], dtype=float32) - longitude(scanline, ground_pixel)float3211.19 11.26 11.32 ... 29.7 29.8
- long_name :
- pixel center longitude
- units :
- degrees_east
- standard_name :
- longitude
- valid_min :
- -180.0
- valid_max :
- 180.0
- bounds :
- /PRODUCT/SUPPORT_DATA/GEOLOCATIONS/longitude_bounds
array([[11.193106 , 11.256816 , 11.31998  , ..., 30.993446 , 31.076    ,
        31.15949  ],
       [11.175201 , 11.23894  , 11.302134 , ..., 30.986917 , 31.069525 ,
        31.153065 ],
       [11.157264 , 11.221032 , 11.284254 , ..., 30.980356 , 31.063015 ,
        31.146603 ],
       ...,
       [ 6.16209  ,  6.234777 ,  6.306873 , ..., 29.611912 , 29.71047  ,
        29.810118 ],
       [ 6.1373053,  6.21004  ,  6.282182 , ..., 29.607084 , 29.705725 ,
        29.805466 ],
       [ 6.1124725,  6.1852536,  6.2574425, ..., 29.602236 , 29.70097  ,
        29.8008   ]], dtype=float32)
- units :
- 1
- proposed_standard_name :
- ultraviolet_aerosol_index
- comment :
- Aerosol index from 380 and 340 nm
- long_name :
- Aerosol index from 380 and 340 nm
- radiation_wavelength :
- [340. 380.]
- ancillary_variables :
- aerosol_index_340_380_precision
Visualise the Sentinel-5P TROPOMI UV Aerosol Index values
For visualization, you can use the function visualize_pcolormesh to visualize the data. The following keyword arguments have to be defined:
data_arraylongitudelatitudeprojectioncolor paletteunitlong_namevmin,vmaxextent (lonmin, lonmax, latmin, latmax)set_global
visualize_pcolormesh(data_array=s5p_uvai_subset,
                     longitude=s5p_uvai_subset.longitude,
                     latitude=s5p_uvai_subset.latitude,
                     projection=ccrs.PlateCarree(),
                     color_scale='afmhot_r',
                     unit=uvai.units,
                     long_name=uvai.long_name + ' ' + str(uvai.time.data)[0:10],
                     vmin=0,
                     vmax=6,
                     lonmin=lonmin,
                     lonmax=lonmax,
                     latmin=latmin,
                     latmax=latmax,
                     set_global=False)
(<Figure size 1440x720 with 2 Axes>,
 <GeoAxesSubplot:title={'center':'Aerosol index from 380 and 340 nm 2021-08-05'}>)
References
Copernicus Sentinel data 2021
Some code in this notebook was adapted from the following source:
copyright: 2022, EUMETSAT
license: MIT
retrieved: 2022-06-28 by Sabrina Szeto
Return to the case study
Monitoring active fires with next-generation satellites: Mediterranean Fires Case Study
Ultraviolet Aerosol Index