Monitoring smoke transport with next-generation satellites from Metop-SG
Contents
Monitoring smoke transport with next-generation satellites from Metop-SG
In the near future, new satellites such as Meteosat Third Generation (MTG) and Metop - Second Generation (Metop-SG) will provide advanced capabilities and valuable data for monitoring fires and their impacts. This two-part case study will introduce upcoming data products from MTG and Metop-SG in the context of the 2020 August Complex fire which occurred in California, USA. In Part 1, we focused on fire monitoring using data products from MTG. Here, we will introduce you to new capabilities in monitoring smoke transport using data products from Metop-SG.
The Case Event
The 2020 August Complex fire was the largest wildfire in California’s history, spreading over 1,000,000 acres (over 4,000 sq km). The fires were caused by a series of lightning strikes on 17 August, resulting in 37 separate fires that merged into a complex. The fires burned for 86 days before being fully contained. On 10 September 2020, CNN reported that the west coast of the US had “the worst air quality in the world” that day, with multiple locations reporting hazardous PM2.5 pollution levels.
EUMETSAT Polar System - Second Generation (EPS-SG)
The EPS-SG is a partnership programme, which involves the European Space Agency, the German Aerospace Agency and the National Center for Space Studies. The mission is composed of two series of spacecraft, Metop-SG A and B, flying on the same mid-morning orbit, like the current Metop satellites. The orbit height is in the range 823-848 km (dependent on latitudes). There will be three satellites each of Metop-SG A and Metop-SG B. The first two satellites Metop-SG A1 and Metop-SG B1 are planned to be launched in Q2 and Q4 2024 respectively. See here an overview of the planned launch dates.
Consisting of low earth orbiting satellites, Metop-SG will provide high spatial resolution imagery and data. However, they will only cover a smaller observation region and have a longer revisit period compared to geostationary satellites like MTG.
In this case study, we will introduce data from three of the EPS-SG instruments: the METimage radiometer, the Ultraviolet Visible Near-Infrared Shortwave (UVNS) spectrometer and the Infrared Atmospheric Sounding Interferometer - New Generation (IASI-NG). While data from these instruments are not yet available, we will be using proxy data from existing instruments to demonstrate the new capabilities that will arise from these upcoming instruments.
What is proxy data?
Proxy data refers to “data with valid scientific content, to be used in early training on instrument capabilities and application areas, for example in test beds. These are real datasets from relevant existing precursor instruments.” (Source: EUMETSAT)
EPS-SG METimage
The METimage radiometer will provide the capability to produce high resolution natural colour imagery that captures the smoke transport from fire-impacted areas. Figure 1 shows a natural colour composite of the coast of northern California from 11 September 2020, one day after much of the smoke was transported westwards over the Pacific Ocean. The composite captures smoke plumes rising from several locations and being transported westwards off the coast into the Pacific Ocean. The proxy data product used is the MODIS Level 1B Calibrated Radiances (MYD021KM) product. Like METimage, MODIS has a spatial resolution of 500m.
METimage is a multi-spectral (visible and IR) imaging passive radiometer which will provide detailed information on clouds, wind, aerosols and surface properties which are essential for meteorological and climate applications. Compared to its predecessor AVHRR, METimage will have many more channels for the benefit of measuring far more geophysical variables. This combined with on-board radiometric calibration of solar channels and the enhanced spatial sampling (500m compared to 1km at nadir) will provide a breakthrough in several application areas: numerical weather forecast, very short-range forecast and now-casting, oceanography, hydrology, land-surface applications, and climate monitoring.
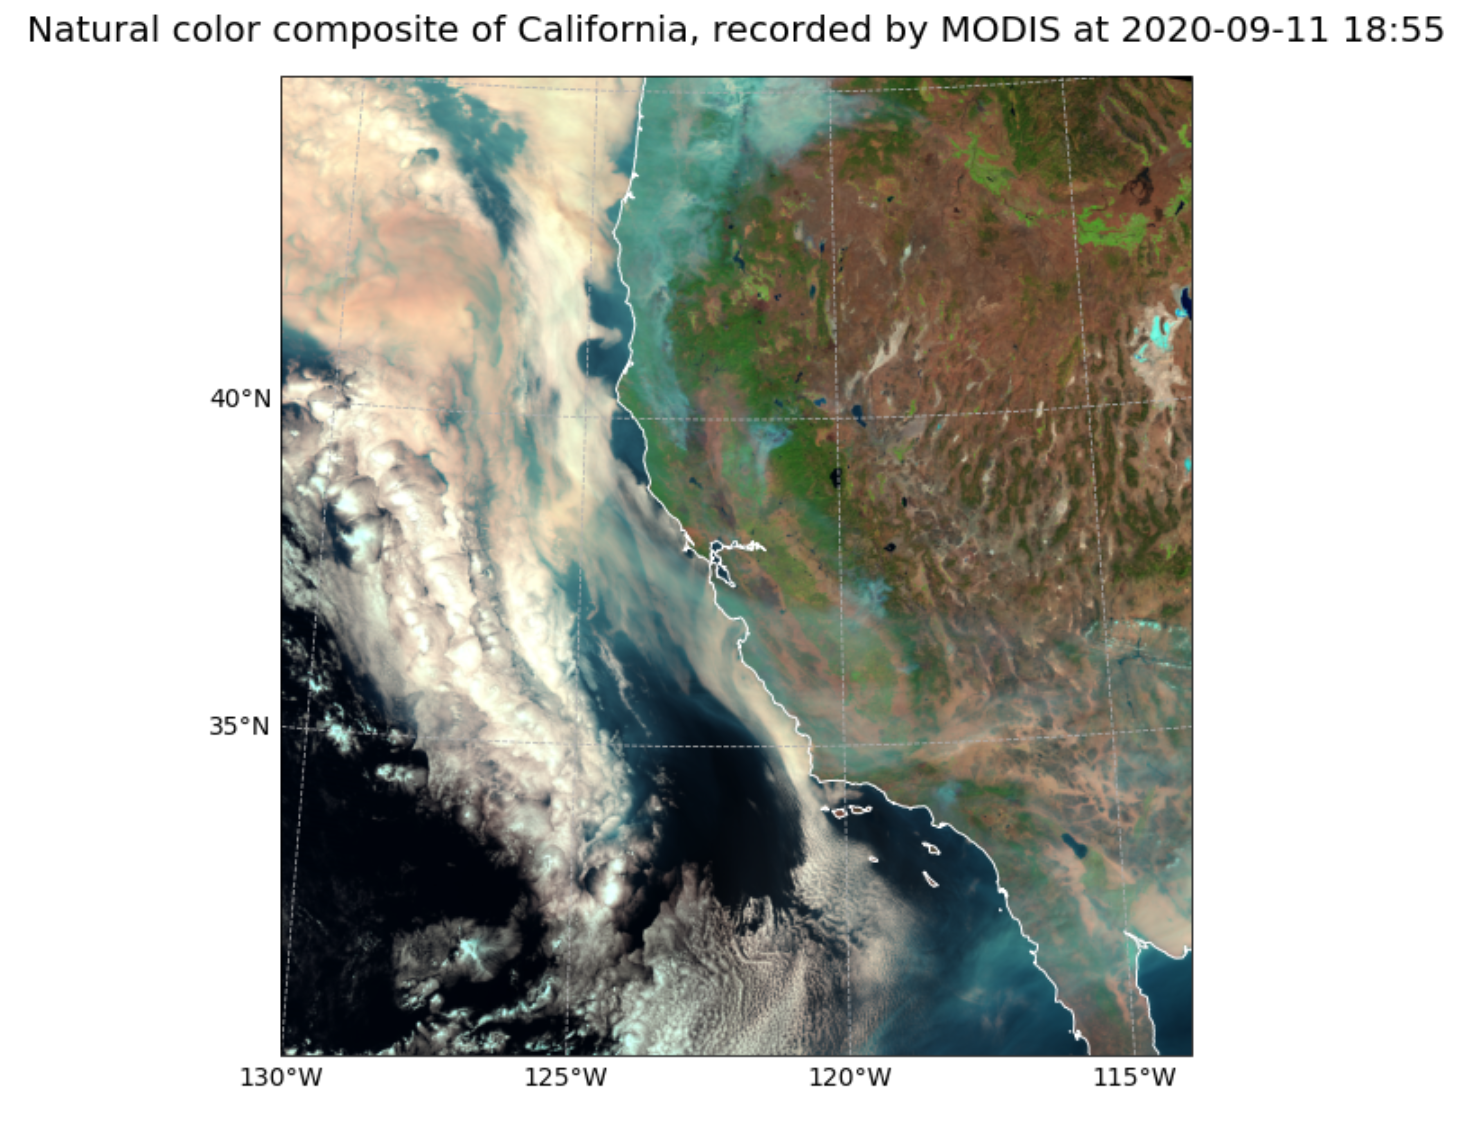
Figure 1. Natural colour composite of California at 500 m spatial resolution recorded by MODIS on 11 September 2020.
Learn how this natural color RGB composite was made.
EPS-SG Sentinel-5 UVNS Ultraviolet Aerosol Index
Biomass burning due to wildfires can lead to elevated levels of absorbing aerosols in the atmosphere. Metop-SG A will carry the Copernicus Sentinel-5 UVNS spectrometer for measurements of trace gases. Compared to its predecessor, GOME-2, the major breakthrough of Sentinel-5 will be a drastically increased spatial sampling at a sampling distance of 7km, and the extension of measurements into the near and short-wave infrared, providing information about aerosols, as well as methane and carbon monoxide in the planetary boundary layer. The UVNS instrument will also provide Aerosol (UV) Absorption index information as a Level 2 product.
The August Complex fire caused an elevated presence of aerosols in the atmosphere as shown by the elevated levels of the aerosol index (UV) Level 2 product in Figure 2. The proxy data comes from Sentinel-5P, the precursor instrument for Sentinel-5.
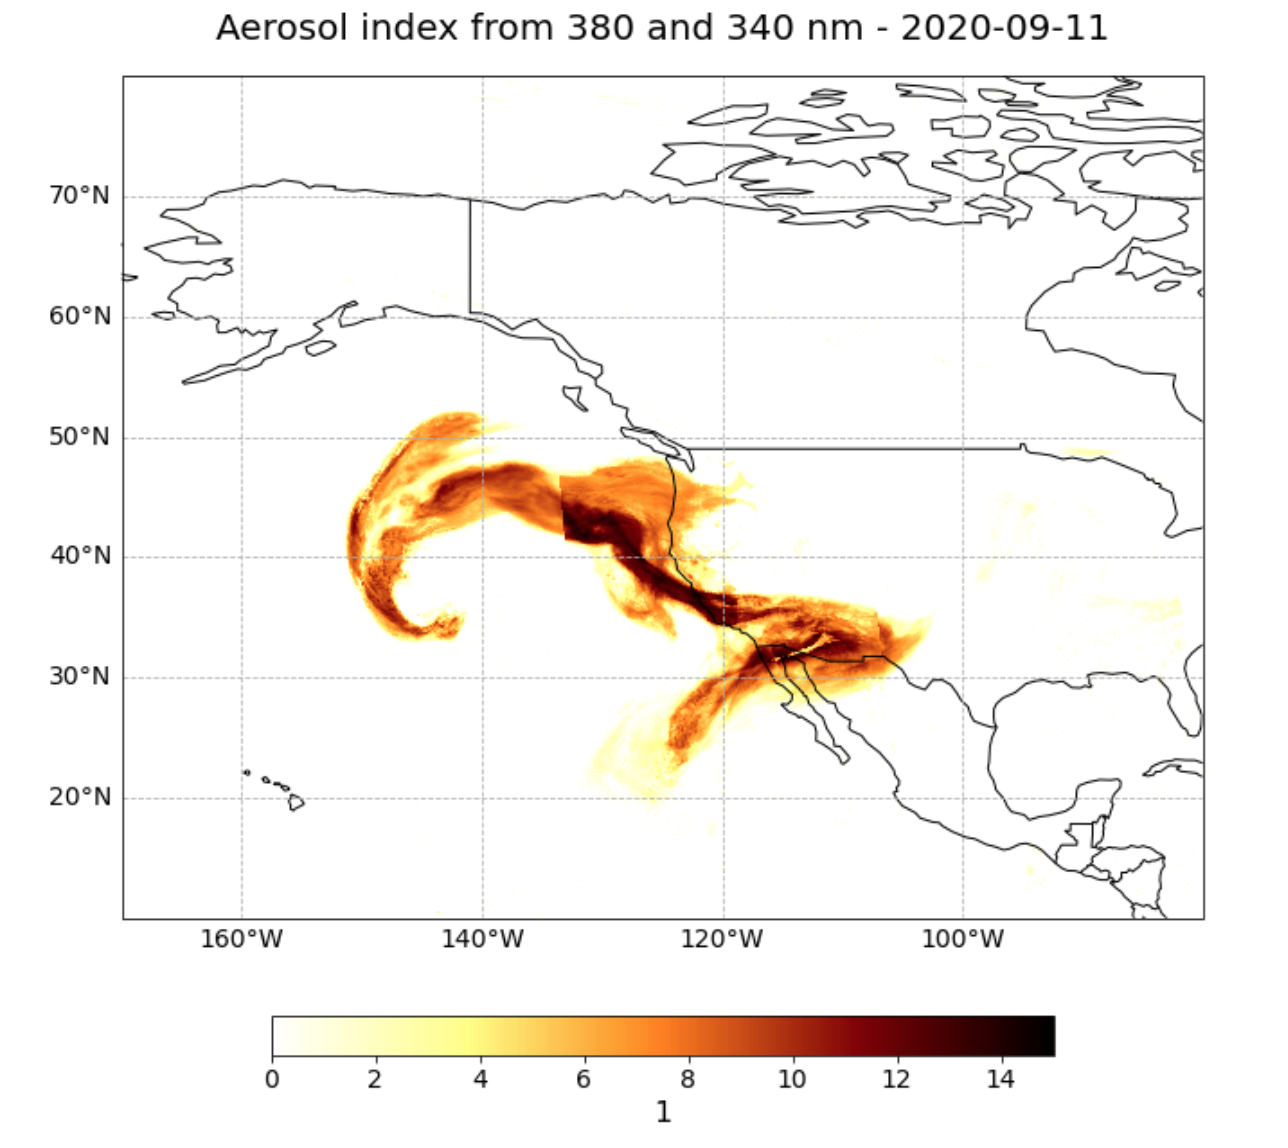
Figure 2. Ultraviolet Aerosol Index (UVAI) Level 2 product from Sentinel-5 TROPOMI over US west coast recorded on 11 September 2020.
Learn how this aerosol index plot was made.
EPS-SG IASI-NG Carbon Monoxide
Smoke from wildfires contains carbon monoxide and other trace gases. The IASI-NG instrument will be able to monitor the elevated carbon monoxide content in the atmosphere, especially during large wildfires. IASI-NG is a passive infrared sounder which has the capability to measure the temperature and water vapour profiles of the Earth’s atmosphere. In addition, the instrument also measures greenhouse gases, clouds, aerosols, ozone and trace gases. IASI-NG will support air quality monitoring at global and regional scales by observation of pollutants in the free troposphere, and the assessment of atmospheric composition. IASI-NG will ensure continuity to EPS-IAS, with improved spectral and radiometric performances.
In Figure 3, the yellow areas of the plot of total column carbon monoxide show that the background value is 2-18 molec./cm2. However, off the coast of the western United States, we see carbon monoxide values which are six times the background value. We can infer that these carbon monoxide values are the result of fire emissions because they have the same shape and occur on the same day as high values in the aerosol index in Figure 2. Their shape is also coherent with atmospheric circulation patterns which are moving the smoke westwards into the Pacific Ocean.
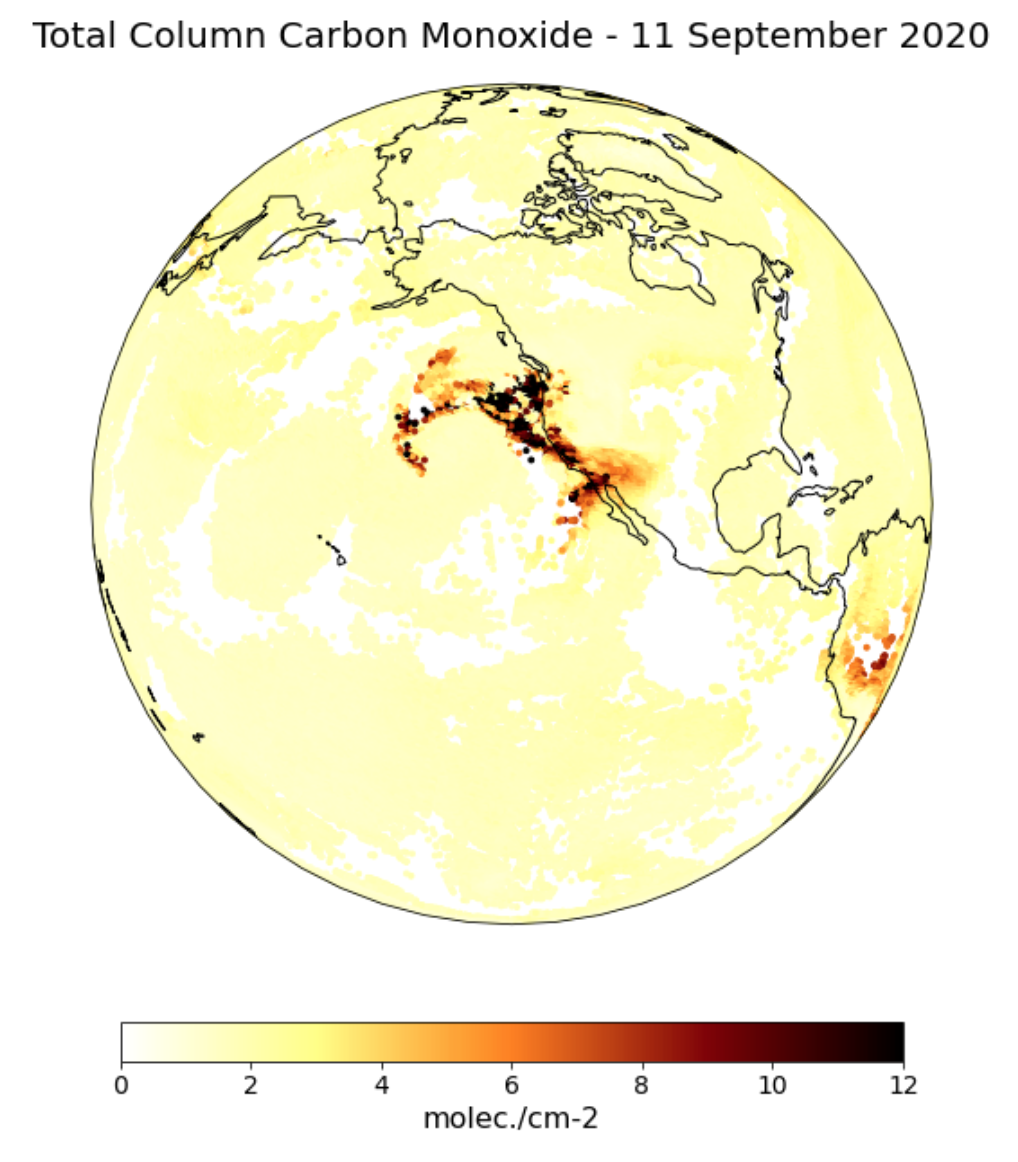
Figure 3. Total Column Carbon Monoxide over the US west coast recorded by the Metop-B IASI instrument on 11 September 2020.
Learn how this plot of total column carbon monoxide was made.
References
MODIS Characterization Support Team (MCST). (2017). MODIS 500m Calbrated Radiance Product. NASA MODIS Adaptive Processing System, Goddard Space Flight Center, USA: http://dx.doi.org/10.5067/MODIS/MOD02HKM.061
Copernicus Sentinel data 2020
IASI is a joint mission of EUMETSAT and the Centre National d’Etudes Spatiales (CNES, France). The authors acknowledge the AERIS data infrastructure for providing access to the IASI data in this study, ULB-LATMOS for the development of the retrieval algorithms, and EUMETSAT/AC SAF for CO data production